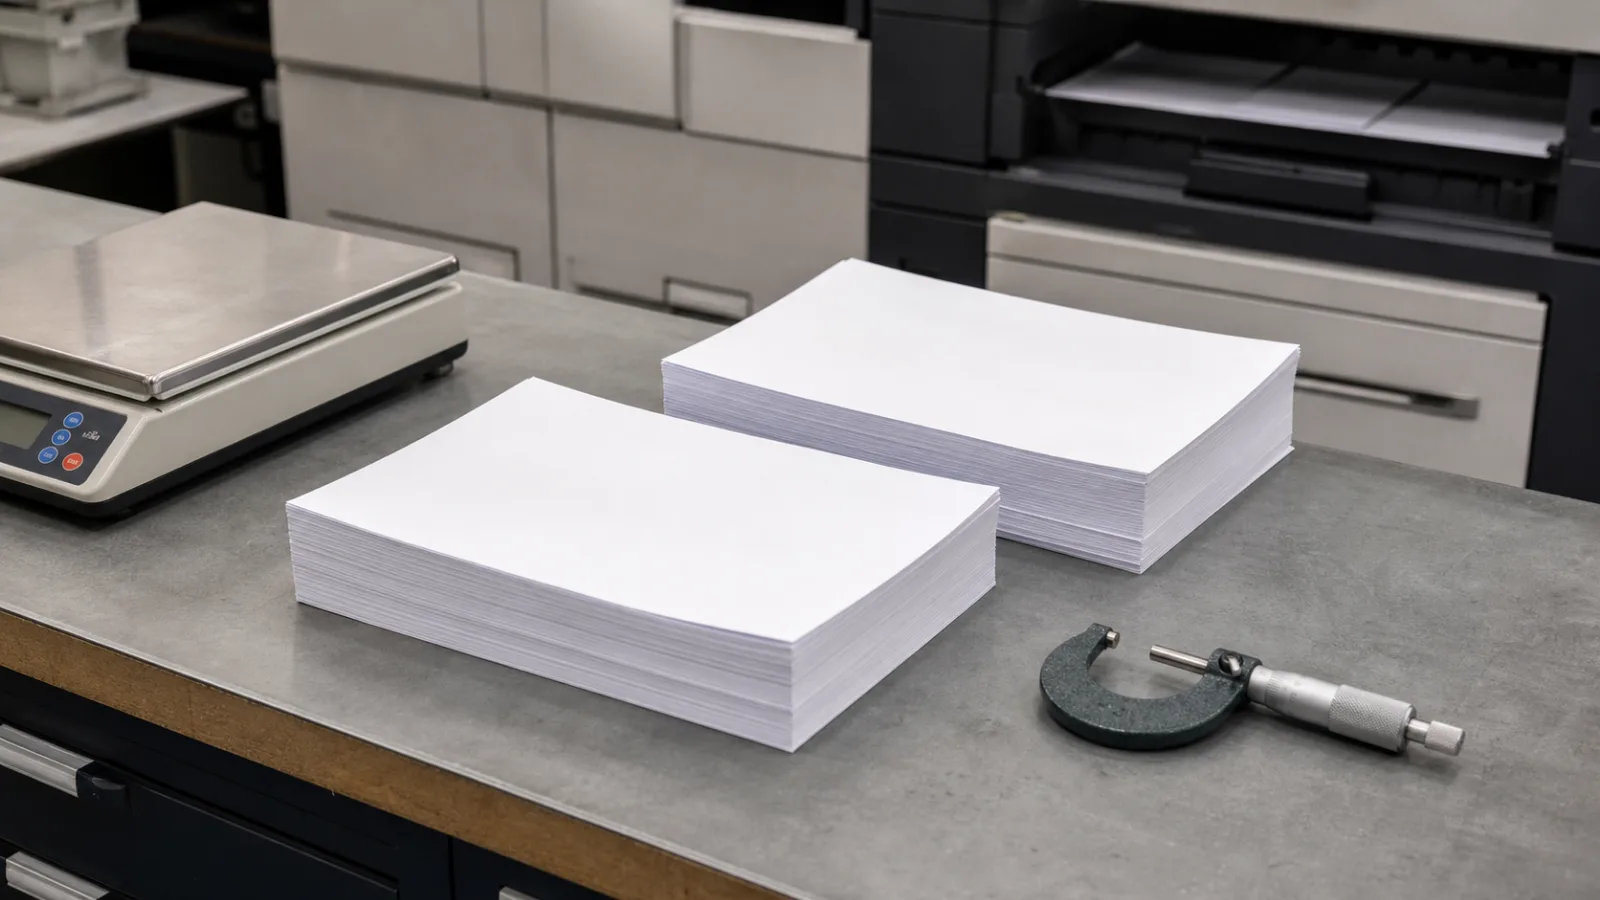


Paper formation describes how evenly fibre and mass are distributed across small areas of a sheet. It is not the same as nominal grammage, caliper, bulk, or visible roughness. A paper can meet its average basis-weight and thickness specification while still containing locally heavier, lighter, denser, or more open areas.
That local structure can matter in printing and converting. Where its scale overlaps with the scale at which ink, coating, light transmission, or mechanical stress varies, formation may contribute to print mottle, uneven apparent density, show-through, local strength variation, or less consistent sheet and web behaviour. It is one variable in a wider system, however. Furnish, moisture, surface treatment, coating, calendering, press settings, ink behaviour, and equipment condition can produce similar symptoms.
For that reason, a formation result is useful only when its measurement method, spatial scale, sample condition, and acceptance purpose are clear.
Paper formation is local sheet uniformity, not grammage or caliper
Grammage is the average mass per unit area, normally stated in g/m². Caliper is sheet thickness under a defined test method and pressure. Bulk expresses the relationship between thickness and grammage. Each is an average or bulk property; none directly describes whether the mass is evenly distributed within small zones of the sheet.
Formation concerns that local distribution. In a well-formed sheet, fibres and fines are dispersed relatively evenly rather than gathered into distinct flocs or leaving locally sparse regions. The word formation is sometimes used for the visual appearance of a sheet held to transmitted light, but that appearance is not automatically identical to mass variation. Optical effects can also be influenced by fibre type, scattering, surface condition, and sheet structure.
A papermaking review in Fundamentals of Papermaking distinguishes mass formation—small-scale grammage variation—from the optical impression of formation. This distinction is useful when interpreting supplier data. An optical image may be highly relevant to visual print appearance, while a mass-based map may be more suitable when local basis-weight distribution is the concern. Neither should be treated as a complete description of printability.
Formation develops predominantly in the forming section, as diluted stock is delivered, dispersed, drained, and consolidated into a wet web. Fibre concentration, stock preparation, refining, wet-end chemistry, shear, turbulence, drainage, and fibre orientation all influence the result. Changes intended to improve formation may also affect drainage, retention, orientation, strength, porosity, or machine operation. There is therefore no universal “best formation” setting independent of grade and end use.
Why local fibre distribution can appear in print
Print uniformity depends on the interaction between the image carrier, ink or toner, substrate surface, and drying or fixing process. Local differences in paper structure can alter that interaction in several ways.
A locally open area may differ from an adjacent dense area in pore volume, absorbency, capillary structure, surface consolidation, or light scattering. Depending on the process and grade, this can affect how quickly liquid ink is immobilised, how deeply part of the vehicle penetrates, how pigment remains at the surface, or how the printed image is visually perceived. In an uncoated sheet, local structural differences may be particularly visible in solids, tints, and smooth tonal areas.
This does not mean every density variation is a formation defect. Ink-water balance, fountain solution, blanket condition, plate wear, anilox volume, gravure-cell condition, drying energy, coating irregularity, and viewing conditions can all create or amplify non-uniformity. A print defect should be diagnosed as a system effect before responsibility is assigned to the sheet.
Research can nevertheless show a relationship under controlled conditions. A study of commercial uncoated fine papers, published as An instrumental determination of the effect of sheet formation on the printability of uncoated fine paper, examined formation and offset print mottle on a stated commercial sheet-fed offset setup. Its scope supports a practical point: formation can be relevant to offset mottle in uncoated fine papers, but the result should not be transferred without qualification to coated papers, labels, board, digital printing, or other press processes.
Similarly, an evaluation of optical formation in SC and newsprint-related work reported that formation measured at a stated 1–4 mm wavelength scale was strongly related to print mottle for the uncoated SC papers evaluated in that work. The report is available as Evaluation of Optical Formation Measurements on Printing. The important lesson is not a universal millimetre limit. It is that the scale of variation matters, and that a measurement method must match the visual or process effect being assessed.
Mottle is not simply average print density
A print can have an acceptable average density yet still look uneven. Mottle concerns spatial variation: adjacent areas differ in apparent darkness, gloss, colour, or texture in a way that is visible in the intended image and viewing condition.
For approval work, inspect both solid and screened areas. A heavy solid may reveal uneven absorption or gloss, while a mid-tone can make local tonal variation more obvious. Include image features that resemble the final application. A plain black solid alone may not expose the same defect as a corporate tint, skin tone, or fine vignette.
Opacity, strength, and sheet behaviour have different pathways
Formation may influence several sheet properties, but it is not their sole cause.
Opacity and show-through
A locally lighter area can transmit more light than a neighbouring heavier area, particularly when the sheet is thin, lightly filled, or printed with high coverage. This may produce uneven show-through or local variation when a sheet is viewed against a contrasting background.
Average opacity remains a separate property. It depends on grammage, fibre composition, fillers, coating, internal light scattering, and other aspects of sheet construction. Two papers with similar average opacity can still differ in the uniformity of transmitted light across the sheet. Conversely, a formation difference may not be visible if the grade’s construction and application mask it.
Strength and converting response
Local fibre crowding and sparse areas can affect structural continuity. In principle, a sparse region may carry load differently from a more consolidated region. But tensile strength, tear resistance, internal bond, stiffness, folding endurance, and edge performance also depend on fibre length, refining, bonding, orientation, moisture, fillers, additives, calendering, and converting history.
Do not infer a strength problem from a formation image alone. Use the relevant grade specification and test method, then assess whether observed breaks, cracks, weak edges, or die-cut failures occur in a repeatable location or direction. Machine-direction and cross-direction differences may point to orientation or web-profile effects rather than small-scale formation alone.
Feeding and web runability
Sheet feeders and web presses respond to many variables beyond formation: moisture profile, curl, static, sheet flatness, roll hardness, winding, edge quality, friction, coating, and press settings are often more immediate causes of runability symptoms.
Formation may still be worth investigating where print defects or mechanical events recur with a particular grade or lot and where other variables have been controlled. For example, an unevenly structured sheet may respond less consistently to ink transfer, coating application, or local mechanical loading. That is a hypothesis to test alongside moisture, geometry, surface, and equipment checks—not a stand-alone diagnosis.
How formation is measured, and why scale matters
Formation can be measured by mass-sensitive methods, optical methods, or imaging systems that generate local property maps. Historical mass-formation approaches include beta radiography combined with microdensitometry or image analysis, as described in Fundamentals of Papermaking. Optical instruments typically analyse transmitted-light images and apply statistical processing to describe variation in the image.
An Optical Paper Formation Analyzer paper defines formation broadly as small-scale variation in fibre or mass distribution and discusses image capture and statistical interpretation. The broad definition is useful, but instrument outputs should not be assumed interchangeable.
Before comparing values, establish the following:
- whether the result is mass-based, optical, or derived from another imaging method;
- the measurement area and sampling plan;
- image resolution, filtering, or wavelength range used in the analysis;
- sample conditioning and whether the sheet was measured before or after finishing;
- calibration and reporting statistic, such as an index, variance, or spectral measure;
- sheet side, machine direction, and whether results represent individual sheets, a reel profile, or a lot average.
A lower or higher formation index has no independent meaning without the instrument’s definition and the agreed acceptance relationship. A supplier may control formation effectively for its own grade, while a printer’s application needs confirmation at a different scale or under a different imaging condition.
Research on gravure-printed SC paper has also used registered maps of local basis weight, topography, ink penetration, gloss, refractive index, and print density. The Graz abstract illustrates why local mapping can be valuable: print-density variation may arise from several local substrate properties at once. A single formation number cannot necessarily isolate the governing mechanism.
What to request from a paper supplier before approval
For demanding print, label, publication, or converting work, request information that connects the candidate grade to its intended use. A useful request includes:
- Named grade and construction: State grade name, grammage, finish, coating status, shade, intended printing process, and, where relevant, producing mill or machine.
- Formation method and result: Ask whether the supplied result is optical or mass-based, the instrument or method used, measurement settings, sample size, and reporting statistic.
- Control context: Ask whether the figure is a typical value, internal target, lot result, or formal acceptance limit. A single typical figure is not the same as a guaranteed tolerance.
- Basis-weight and moisture information: Request relevant average values and profiles where available. Local formation is not replaced by these data, but profile variation can create separate press and converting risks.
- Relevant optical and mechanical data: Match the request to the application: opacity, brightness or colour, gloss, roughness, tensile, tear, stiffness, internal bond, moisture, curl, or dimensional stability may be relevant depending on the grade and process.
- Representative samples: Obtain samples from the production lot or an agreed representative lot, not only an untraceable swatch book.
- Process history: Ask whether the grade has documented use in a comparable process. Treat this as context, not a guarantee, unless the machine, image, ink, finishing, and acceptance conditions are genuinely comparable.
If formation is a critical acceptance variable, write the method and scale into the specification. “Good formation” is not auditable. “Optical formation measured using the agreed instrument settings and reported statistic, assessed against approved reference samples” is more actionable, even if the final numerical limit remains internal.
Evaluate formation under actual printing and converting conditions
The most reliable approval method is a controlled production-relevant comparison. Use representative paper lots and retain unprinted controls. Keep the trial focused enough that a difference in output can be investigated rather than merely observed.
A practical workflow is:
- Define the risk. Specify whether the concern is mottle, show-through, image-density variation, cracking, weak die-cut areas, web breaks, or another observable outcome.
- Agree the reference. Retain an approved sheet, reel, printed sample, or defect sample. Define viewing lighting, inspection distance, image area, and acceptable variation before the trial.
- Condition and identify samples. Record lot, sheet side, grain direction, storage conditions, moisture condition where measured, and sampling location across the reel or pallet.
- Use a relevant diagnostic image. Include solids, tints, screened tones, reverses, and fine detail that resemble the finished job. For converting, include the actual coating, adhesive, die-cut, embossing, or folding operation where practical.
- Record process conditions. Capture press, ink, plate, blanket, anilox, cylinder, drying, tension, speed, and environmental settings that could influence the result.
- Inspect and measure consistently. Compare visual uniformity under agreed lighting. Where suitable equipment is available, measure density, colour variation, gloss variation, opacity, or other defined output metrics at representative locations.
- Escalate by elimination. If a defect appears, check moisture, surface condition, ink transfer, press settings, roller or blanket condition, coating, winding, and mechanical alignment alongside formation evidence.
Do not approve or reject a grade on a formation value alone. Select it against a documented combination of formation method, print-uniformity requirement, optical needs, mechanical properties, converting conditions, and reference samples from the actual process.
Frequently asked questions
What is the difference between paper formation and grammage?
Grammage is the average mass per unit area of a sheet. Formation describes how evenly that mass and fibre structure are distributed locally. Two sheets can have the same grammage but different formation.
Can poor paper formation cause print mottle?
It can contribute to print mottle when local structural variation affects ink transfer, penetration, surface response, or visual light scattering at a relevant scale. It is not the only possible cause. Confirm the relationship through controlled trials on the intended paper, press, image, and ink system.
What formation data should a printer request from a paper supplier?
Request the named grade, measurement method, instrument settings, sample conditioning, measurement scale, reported statistic, control context, and representative lot samples. Also request the optical, moisture, strength, and surface data relevant to the application.
Why can two sheets with the same basis weight print differently?
Average basis weight does not describe local fibre distribution, surface structure, porosity, coating, moisture, calendering, or optical behaviour. Any of these can alter ink response and image appearance. Compare the sheets under controlled printing conditions rather than assuming equal grammage means equal print performance.